
Changes in non-OPEC production can affect oil prices
Non-OPEC countries contribute approximately 60% to global oil output. Central to this non-OPEC production are North America, regions of the former Soviet Union, and the North Sea.
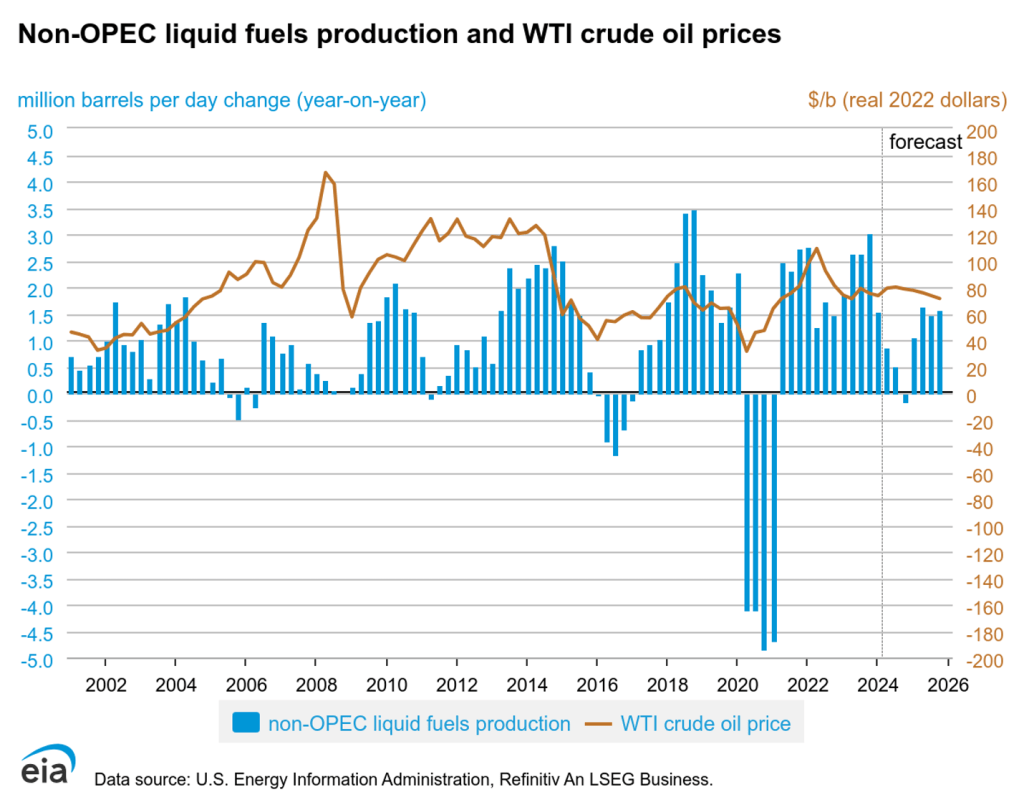
The chart indicates that from 2005 to 2008, there was only a marginal net increase in oil production from non-OPEC countries. This modest growth in supply from non-OPEC played a significant role in tightening the oil market during this period. The constrained expansion in non-OPEC oil production underscores the challenges in meeting global demand and emphasizes the critical influence of these countries on the overall market balance.
Supply OPEC
Crude oil production levels set by the Organization of the Petroleum Exporting Countries (OPEC) significantly influence global oil prices. OPEC actively manages oil output within its member states by establishing production quotas, aiming to stabilize or influence the international oil market. Historical data indicate that crude oil prices often rise following the organization’s decisions to lower production targets.
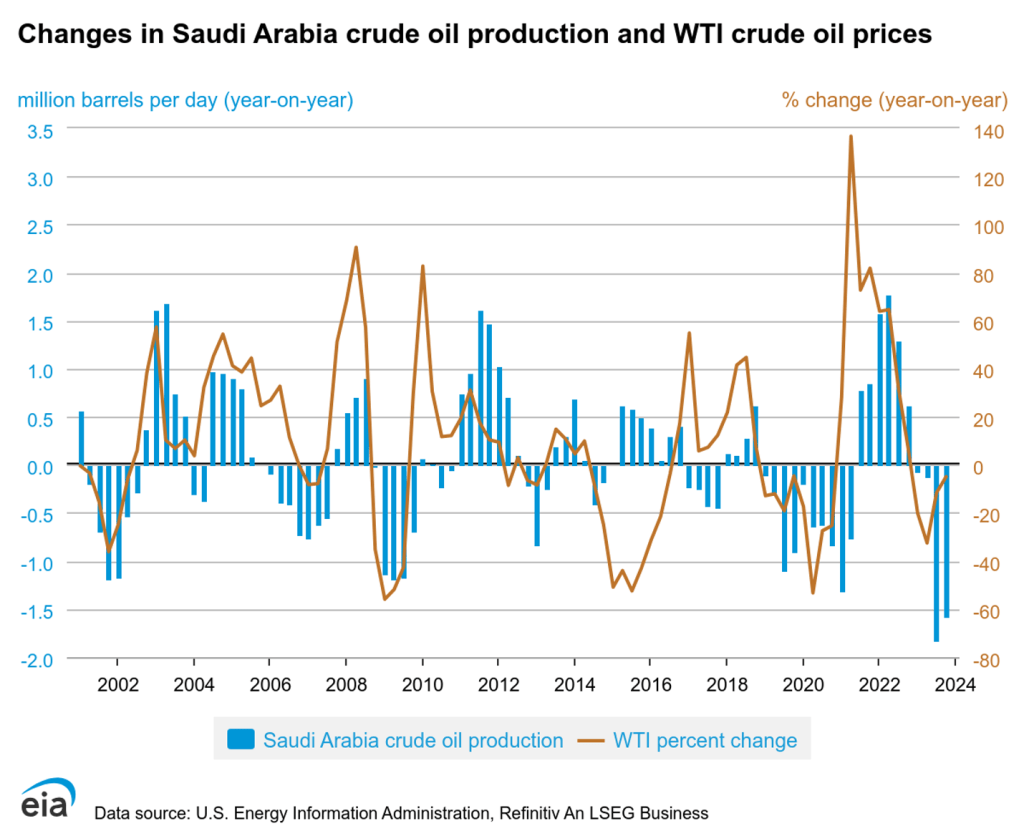
Oil markets are highly sensitive to shifts in anticipated supply and demand dynamics. The provided chart, illustrating the correlation between projections for changes in Saudi Arabian crude oil production and fluctuations in West Texas Intermediate (WTI) crude oil prices, exemplifies this responsiveness. When expectations lean towards a decrease in Saudi production, it typically leads to an uptick in WTI prices, reflecting market concerns over tighter supply. Conversely, predictions of increased production from Saudi Arabia can cause WTI prices to fall, as the market anticipates a more abundant supply.
Demand Non-OECD
In recent years, oil consumption within developing nations outside of the Organization for Economic Cooperation and Development (OECD) has experienced a significant surge. In contrast, OECD countries saw a decline in oil consumption from 2000 to 2010. During this decade, non-OECD oil consumption witnessed an increase of over 40%, underlining a marked divergence in energy consumption patterns between developed and developing economies. Notably, China, India, and Saudi Arabia were at the forefront of this growth among non-OECD countries, recording the largest increments in oil consumption. This trend reflects broader economic and industrial expansion within these nations, contributing to their escalating energy needs and underscoring the shifting landscape of global oil demand.
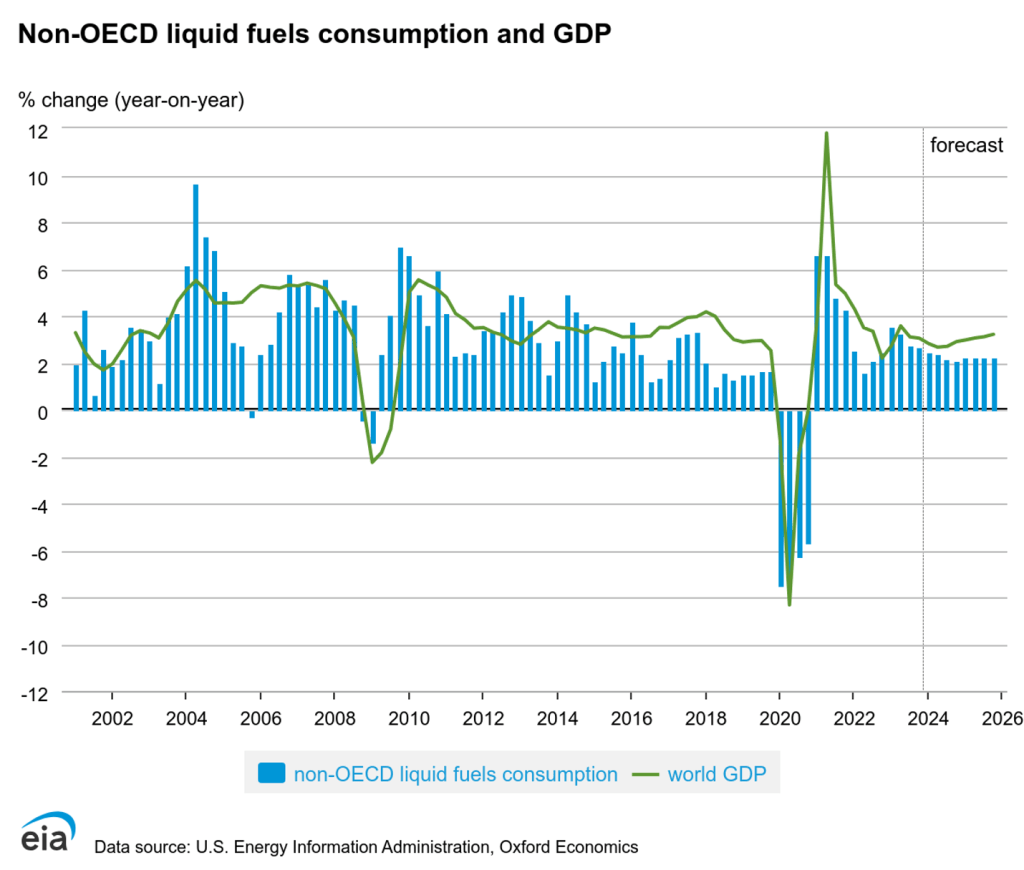
The chart presents a pronounced correlation between GDP growth rates and the increase in oil consumption within non-OECD countries. Since 2001, there have only been three instances where oil consumption in these countries has seen a decline. This trend suggests that the upward pressure on oil demand, driven by economic expansion, has consistently outweighed any potential decrease in consumption attributed to rising oil prices. In essence, the robust economic growth within non-OECD nations has been a primary driver for heightened oil demand, indicating that these economies have, to a significant extent, absorbed higher oil prices without a substantial reduction in consumption. This dynamic highlights the critical influence of economic performance on energy demand patterns, especially in emerging and developing markets.
Demand OECD
OECD, encompassing the United States, numerous European nations, and other developed economies, accounted for 46% of the world’s oil consumption in 2021. This statistic reveals that these advanced economies are now surpassed in oil consumption by non-OECD countries, which have demonstrated either stagnant or diminishing growth in oil demand. Notably, oil consumption within OECD countries reached its zenith in 2005 and has not surpassed that level since. Conversely, oil consumption in non-OECD nations has surged by more than 50% following 2005, illustrating a significant shift in global energy consumption patterns.
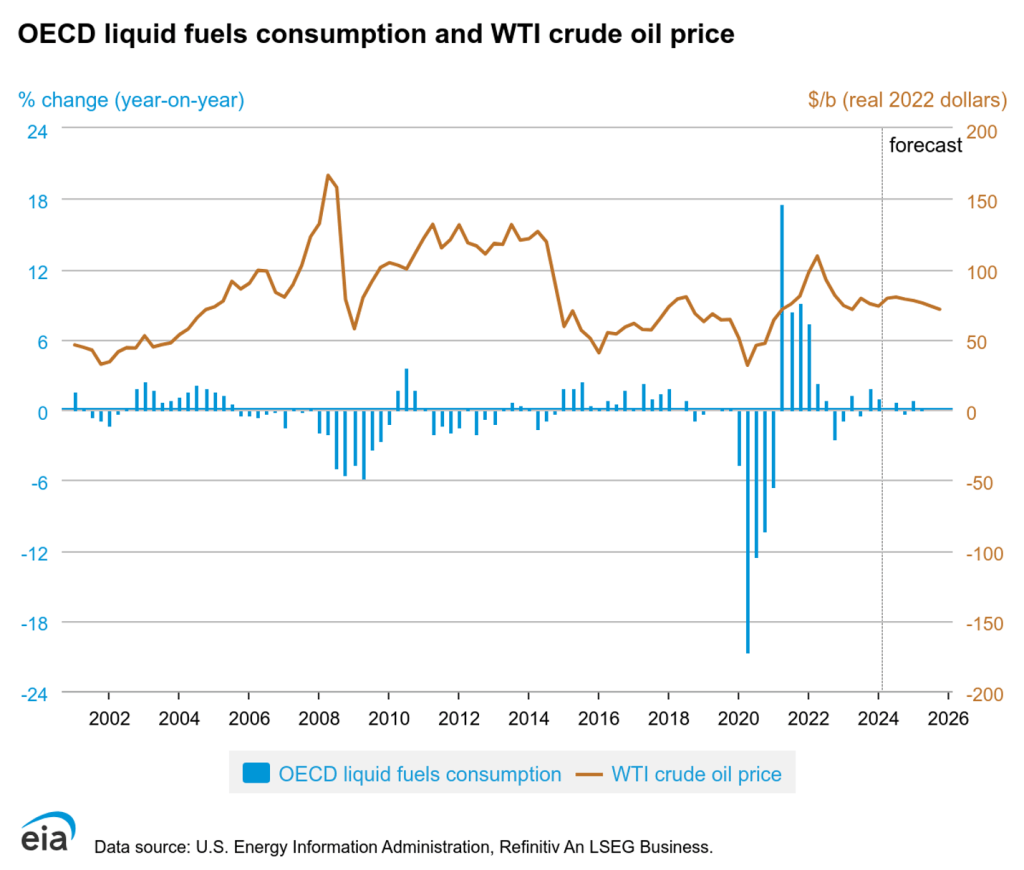
In a marked contrast to the trend observed in non-OECD countries, oil consumption within OECD nations experienced a decline from 2006 to 2009, coinciding with periods of rising oil prices and further exacerbated by the economic downturn. This decrease can be attributed to relatively slower economic growth rates and the mature state of transportation sectors within these countries, factors that render oil consumption more sensitive to price fluctuations. Consequently, the responsiveness of OECD oil demand to price changes has been more pronounced compared to non-OECD countries, where robust economic expansion and developing transportation infrastructures have sustained, if not increased, oil consumption despite rising prices. This distinction underscores the divergent impacts of economic, industrial, and market dynamics on oil consumption patterns between developed and developing economies.
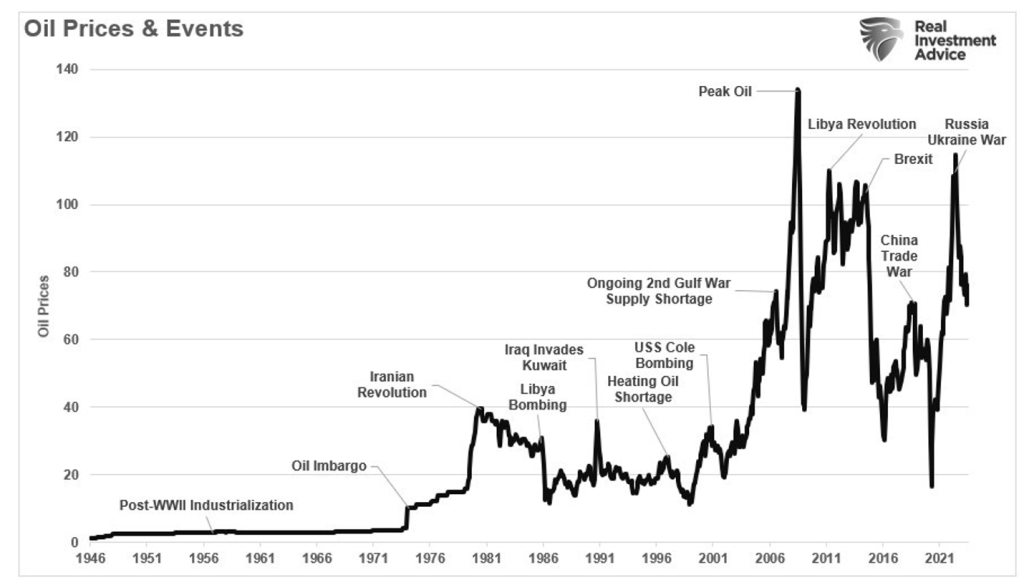
Geopolitical and economic events
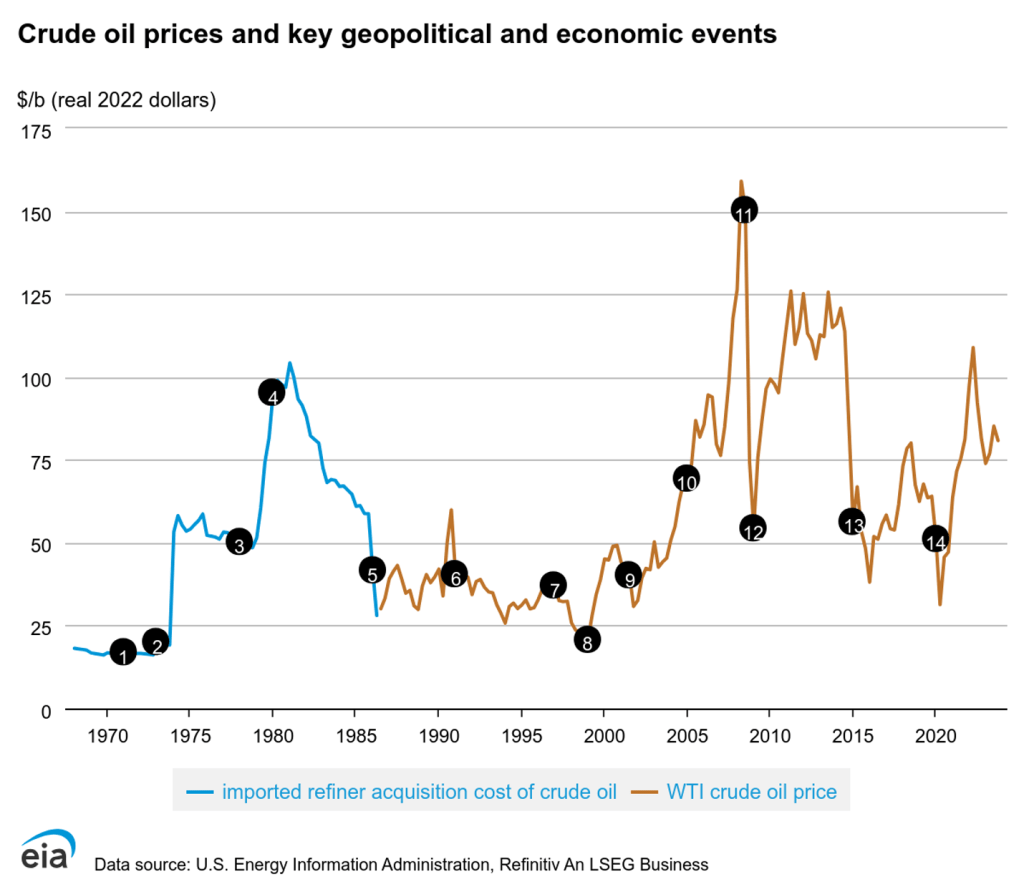
- 1: US spare capacity exhausted
- 2: Arab Oil Embargo
- 3: Iranian Revolution
- 4: Iran-Iraq War
- 5: Saudis abandon swing producer role
- 6: Iraq invades Kuwait
- 7: Asian financial crisis
- 8: OPEC cuts production targets 1.7 mmbpd
- 9: 9-11 attacks
- 10: Low spare capacity
- 11: Global financial collapse
- 12: OPEC cuts production targets 4.2 mmbpd
- 13: OPEC production quota unchanged
- 14: Global pandemic reduces oil demand
Other Financial Markets
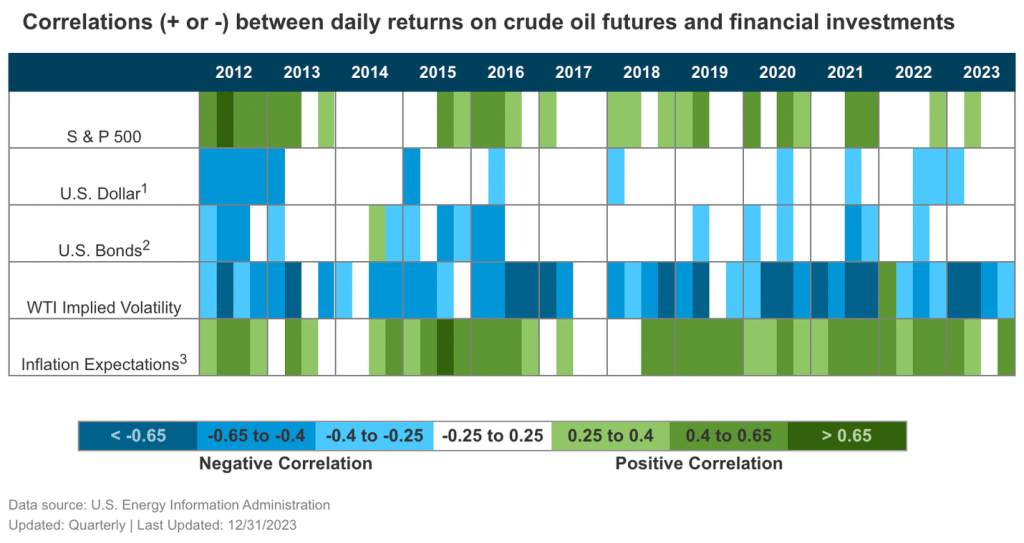
This chart shows the correlations (co-movements) between oil futures prices and other financial markets on a daily basis. In recent years, oil prices and the S&P 500 have tended to move together, while oil prices have tended to move in the opposite direction of the dollar exchange rate and Treasury bonds.
